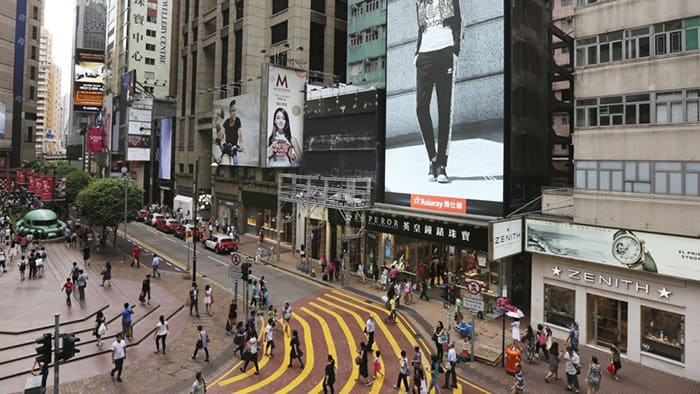
Russell Street in Causeway Bay is the most expensive retail area in Asia
Shops may be closing due to disappointing sales in Hong Kong’s Causeway Bay area, but the glitzy shopping street still hung onto its rank as the second-most expensive place to rent a shop in the world, behind only New York’s Fifth Avenue.
Shopfront rentals in Causeway Bay fell by an average of 13.9 percent from June 2014 to June 2015, bringing the monthly cost of leasing a square foot of space in the Hong Kong retail district to HK$1550 ($200), according to a report released today by Cushman & Wakefield.
Hong Kong remains the most expensive place to rent shop space in Asia by a wide margin, with Tokyo’s Ginza being the only other Asian location to land in the top 10 globally.
New York on the Way Up, While Hong Kong is Still Sliding
In contrast to Hong Kong’s falling rents, which are said to be due to a fall in tourist numbers from the mainland, rents on New York’s Upper Fifth Avenue rose by 3.6 percent in the last year, according to the real estate consultancy, meaning the average retailer leasing a square foot of space in the swanky shopping area would need to pay $292 per month, or $3,500 per year. Could the rise in New York prices – which are now nearly 50 percent more than the highest in Hong Kong be due to mainlanders now taking their tourist dollars to the Big Apple?
In Causeway Bay a number of retailers have given up their shop space due to falling business in recent months, with landlords forced into the unfamiliar situation of scrambling to find new tenants, often from among more mass market consumer brands. In August of this year, luxury handbag maker Coach closed its flagship store in Hong Kong’s Central district, only to be replaced by Adidas, at a significantly lower rent.
Just behind Causeway Bay in the list of the world’s priciest places to rent a shop were Paris’ Champs D’Elysee, London’s New Bond Street, and Milan’s Via Montenapoleone. The following table provides a list of the 65 most expensive cities in the world, based on Cushman & Wakefield’s data
| 2015 Rank | 2014 Rank | City | Country | Location | $/Sqft/Yr | €/Sqm/Yr |
|---|---|---|---|---|---|---|
| 1 | 1 | New York | USA | Upper 5th Avenue | 3500 | 33812 |
| 2 | 2 | Hong Kong | China | Causeway Bay | 2399 | 23178 |
| 3 | 3 | Paris | France | Avenue des Champs Elysees | 1372 | 13255 |
| 4 | 4 | London | United Kingdom | New Bond Street | 1321 | 12762 |
| 5 | 6 | Milan | Italy | Via Montenapoleone | 1035 | 10000 |
| 6 | 8 | Zurich | Switzerland | Bahnhofstrasse | 895 | 8643 |
| 7 | 5 | Tokyo | Japan | The Ginza | 882 | 8520 |
| 8 | 7 | Seoul | South Korea | Myeongdong | 882 | 8519 |
| 9 | 9 | Vienna | Austria | Kohlmarkt | 478 | 4620 |
| 10 | 11 | Munich | Germany | Kaufinger/Neuhauser | 460 | 4440 |
| 11 | 12 | Shanghai | China | West Nanjing Road | 438 | 4233 |
| 12 | 10 | Moscow | Russia | Stoleshnikov | 395 | 3814 |
| 13 | 16 | Singapore | Singapore | Orchard Road | 337 | 3253 |
| 14 | 13 | Barcelona | Spain | Portal de L'Angel | 335 | 3240 |
| 15 | 14 | Melbourne | Australia | Bourke Street | 321 | 3104 |
| 16 | 19 | Dublin | Ireland | Grafton Street | 320 | 3091 |
| 17 | 18 | Istanbul | Turkey | Bagdat Caddesi | 312 | 3016 |
| 18 | 17 | Amsterdam | Netherlands | Kalverstraat | 300 | 2900 |
| 19 | 15 | Oslo | Norway | Karl Johan | 295 | 2852 |
| 20 | 23 | Taipei | Taiwan | ZhongXiao E. Road | 273 | 2640 |
| 21 | 20 | Toronto | Canada | Bloor Street | 260 | 2515 |
| 22 | 21 | Copenhagen | Denmark | Stroget | 250 | 2413 |
| 23 | 22 | Prague | Czech Republic | Wenceslas Square | 236 | 2280 |
| 24 | 26 | New Delhi | India | Khan Market | 236 | 2276 |
| 25 | 25 | Athens | Greece | Ermou | 224 | 2160 |
| 26 | 27 | Helsinki | Finland | City Centre | 204 | 1968 |
| 27 | 28 | Antwerp | Belgium | Meir | 181 | 1750 |
| 28 | 30 | Auckland | New Zealand | Queen Street | 173 | 1675 |
| 29 | 31 | Luxembourg City | Luxembourg | Grand Rue | 168 | 1620 |
| 30 | 24 | Kiev | Ukraine | Kreschatik Street | 168 | 1616 |
| 31 | 29 | Stockholm | Sweden | Biblioteksgatan | 167 | 1612 |
| 32 | 33 | Ho Chi Minh City | Vietnam | Prime High Street | 150 | 1447 |
| 33 | 34 | Dubai | UAE | Prime - A | 151 | 1454 |
| 34 | 35 | Tel Aviv | Israel | Kikar Hamedina | 150 | 1447 |
| 35 | 44 | Bangkok | Thailand | Rajprasong/SukhumvitRoad | 125 | 1212 |
| 36 | 42 | Buenos Aires | Argentina | Florida | 125 | 1206 |
| 37 | 38 | Lisbon | Portugal | Chiado | 121 | 1170 |
| 38 | 36 | Budapest | Hungary | Vaci utca | 118 | 1140 |
| 39 | 32 | Rio de Janeiro | Brazil | Garcia D’avilla | 117 | 1127 |
| 40 | 39 | Kuala Lumpur | Malaysia | Bukit Bintang | 111 | 1075 |
| 41 | 43 | St Peter Port | Channel Islands | High Street | 107 | 1033 |
| 42 | 40 | Belgrade | Serbia | Kneza Mihaila | 106 | 1020 |
| 43 | 41 | Warsaw | Poland | Nowy Swiat | 106 | 1020 |
| 44 | 46 | Mexico City | Mexico | Mazaryk | 103 | 991 |
| 45 | 37 | Bogota | Colombia | Zona T - 82 Calle | 100 | 969 |
| 46 | 47 | Almaty | Kazakhstan | Gogol, Furmanov | 100 | 969 |
| 47 | 48 | Doha | Qatar | Prime High Street | 92 | 887 |
| 48 | 50 | Beirut | Lebanon | Rue Verdun | 88 | 853 |
| 49 | 45 | Zagreb | Croatia | Ilica Street | 87 | 840 |
| 50 | 49 | Ljubljana | Slovenia | Čopova | 75 | 720 |
| 51 | 59 | Taguig (Metro Manila) | Philippines | Bonifacio High Street | 56 | 545 |
| 52 | 51 | Bucharest | Romania | Magheru Boulevard | 56 | 540 |
| 53 | 54 | Bratislava | Slovakia | Obchodna ulica | 55 | 528 |
| 54 | 52 | Sofia | Bulgaria | Vitosha Blvd. | 55 | 528 |
| 55 | 57 | Juffair | Bahrain | Prime High Street | 53 | 514 |
| 56 | 53 | Tbilisi | Georgia | Pekini Street | 50 | 485 |
| 57 | 55 | Vilnius | Lithuania | Gedimino Ave | 50 | 480 |
| 58 | 58 | Lima | Peru | San Isidro | 47 | 452 |
| 59 | 61 | Muscat | Oman | High Street | 43 | 420 |
| 60 | 56 | Skopje | Macedonia | Makedonija Street | 37 | 360 |
| 61 | 60 | Riga | Latvia | Kalku St./Valnu St./Audeju | 37 | 360 |
| 62 | 62 | Quito | Ecuador | Av Naciones Unidas | 36 | 345 |
| 63 | 63 | Tallinn | Estonia | Viru Street | 31 | 300 |
| 64 | 65 | Belleville | South Africa | Durban Road | 23 | 222 |
| 65 | 64 | Limassol | Cyprus | Anexartisisas Ave | 22 | 216 |
Retail Rents Still Climbing on the Mainland
While many stories have been written about China’s corruption crackdown and an economic slowdown, retail rents continue to climb on the mainland, as they do in most Asian cities.
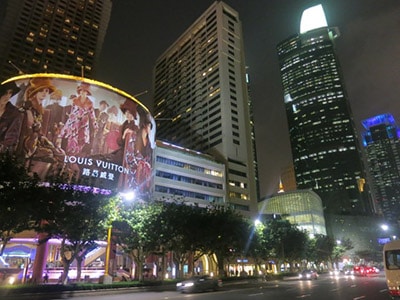
West Nanjing Road in Jing’An district has the priciest street-front rentals in Shanghai
Beijing’s Wangfujing area had the highest rental rates of any shopping street in China, at RMB 2,820 per square metre, per month, up by 8.5 percent compared to 2014. Shanghai ranked second among mainland cities, with average street-front rentals up 6.0 percent in the last year to reach RMB 2,437 per square metre, per month along the West Nanjing Road area in Jing’An district. (Which probably explains the high cost of Mingtiandi’s lunch every day).
Despite sliding forecasts for China’s topline GDP growth, the nation’s retail sales for the first ten months of this year grew by 11 percent compared to the same period in 2014, with the October government numbers showing the highest rate of growth so far during 2015.
The exception to the mainland’s rising retail rent rule was Chengdu, which saw rents drop by 5.6 percent in the last year, after the capital of southwestern China’s Sichuan province was inundated with new shop space.
The only other cities in Asia to report falling shop rentals were Singapore, where rates along Orchard Road fell by 1.8 percent in the last year to S$38 per square foot per month, and Kuala Lumpur, which reported a rental decrease of 3.5 percent. A full list of the highest rental rates in each major Asian city is contained in the following table.
| City | Country | Location | Annual Rental Growth % | $/Sqft/Yr | €/Sqm/Yr |
|---|---|---|---|---|---|
| Hong Kong | China | Causeway Bay | -13.9% | 2399.2 | 23178 |
| Tokyo | Japan | The Ginza | 3.2% | 881.9 | 8520 |
| Seoul | South Korea | Myeongdong | 0.0% | 881.8 | 8519 |
| Beijing | China | Wangfujing | 8.5% | 507 | 4898 |
| Shanghai | China | West Nanjing Road | 6.0% | 438.1 | 4233 |
| Guangzhou | China | Tianhe | 6.5% | 413.5 | 3995 |
| Singapore | Singapore | Orchard Road | -1.8% | 336.8 | 3253 |
| Chengdu | China | Chunxi Road | -5.6% | 302.6 | 2923 |
| Shenzhen | China | Luohu | 0.9% | 295.2 | 2852 |
| Taipei | Taiwan | ZhongXiao E. Road | 4.2% | 273.2 | 2640 |
| Kuala Lumpur | Malaysia | Pavillion KL | -3.5% | 260.8 | 2519 |
| New Delhi | India | Khan Market | 0.0% | 235.6 | 2276 |
| Ho Chi Minh City | Vietnam | Prime High Street | 0.0% | 150.5 | 1454 |
| Hanoi | Vietnam | CBD Fringe | 0.0% | 133.8 | 1292 |
| Bangkok | Thailand | Rajprasong/Sukhumvit Road | 15.2% | 125.4 | 1212 |
| Makati (Metro Manila) | Philippines | Makati CBD | 22.4% | 58 | 560 |
The rental rates were published in Cushman & Wakefield’s annual report, ‘Main Streets Across the World,’ which tracks over 500 of the top high street retail areas around the globe, ranking them by average rental values. The 27th edition of the report shows that rents have risen in 35% of streets around the world – despite the increased global uncertainty experienced over the past 12 months.
While the ‘Main Streets Across the World,’ report is published by Cushman & Wakefield globally, the company is known as DTZ/Cushman & Wakefield in China, after the two real estate consultancies formally merged in September of this year.
Leave a Reply